


Define the buying decision first
A comparison becomes useful when the reader knows what choice it supports. Name the products, the customer segment, and the job they are being compared for. “Notion vs Coda vs Confluence for a 50-person product team” gives the research more direction than a list of three names.
Keep the first run to a focused group of direct alternatives. If you need to compare an entire market, divide it into categories such as enterprise suites, specialist tools, and lower-cost entrants. Mixing all of them in one table can make an obvious category difference look like a product insight.
Make the criteria comparable
Write down the questions the dashboard should answer before looking at the charts. Pricing, permissions, integrations, onboarding, support, and deployment may matter, but not every criterion deserves equal weight.
Watch for metrics that share a label but not a definition. A “free plan” may limit users, projects, storage, exports, or usage in different ways. A feature can exist on one plan and require an add-on on another. Record the unit, plan, region, and date beside the value.
Follow findings back to sources
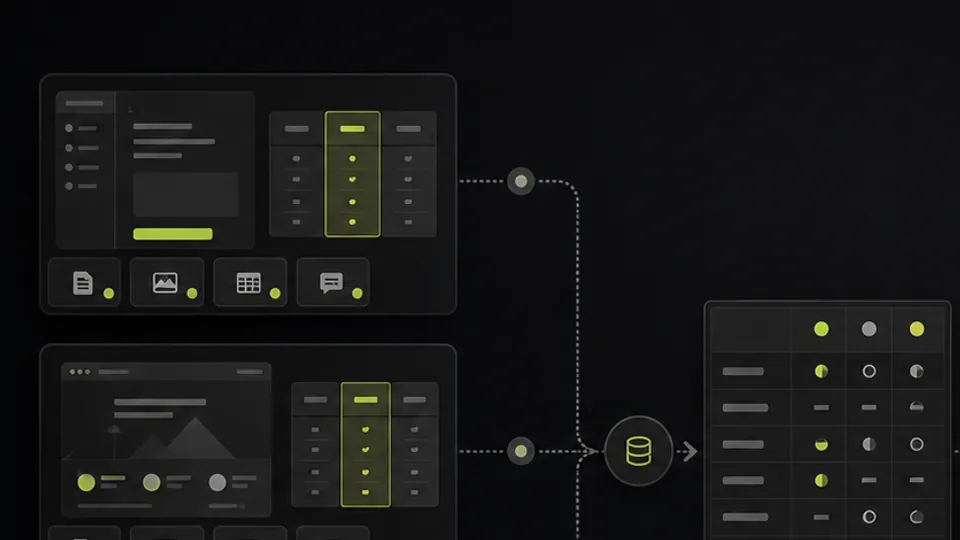
The workflow searches broadly, then opens the most relevant product and pricing pages. Use those source pages to verify the claims that will influence a decision. A review site can show recurring complaints, but official documentation is usually better evidence for current limits and supported features.
Recent news needs the same care. Confirm the event date rather than the page’s update date, and separate an announced feature from one generally available to customers. If a source conflicts with another, keep the disagreement visible instead of choosing the more convenient number.
Keep the dashboard narrow enough to read
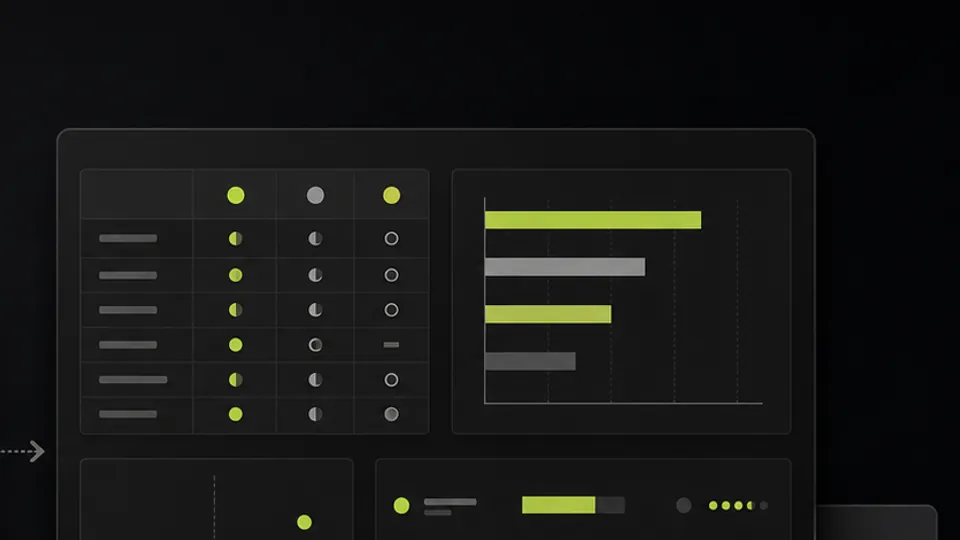
One useful chart is better than six generic metrics. Lead with the comparison that changes the decision, then use a table for the details behind it. The presentation can explain why those criteria matter, who each product fits, and which unknowns still require a trial or sales conversation.
Label recommendations as analysis, not source facts. A product can score well for one team and poorly for another because the weights are different. For the underlying research method, see how to create a source-backed report. To turn a market argument into slides, continue with the pitch deck guide.
Before you share the analysis
- The competitors belong to the same decision.
- Every price includes its currency, billing period, and plan.
- Feature claims link back to a current source.
- Announced and available capabilities are not mixed together.
- Charts use comparable definitions and units.
- Recommendations state the criteria and remaining unknowns.